Applied power markets research
NYISO virtual bidding, storage value, and grid security on six months of market data
Walk-forward evaluation of day-ahead/real-time virtuals, battery arbitrage bounds, VaR calibration, and N-1 security cost on NYISO zone prices from January through June 2026.
NYISO, 11 load zones · 2026-01-01 to 2026-06-30 · 47,773 zone-hours
Over the full sample the NYISO day-ahead/real-time (DART) spread averages +$6.29/MWh, almost entirely from January (+$38.37/MWh). An unconditional virtual supply (INC) position earns +$5.99/MWh net of a $0.30/MWh fee on the full panel. Under walk-forward evaluation that holds out the first ~28 zone-days for feature warmup and then scores every later hour out of sample, the OOS mean DART is still positive (+$2.39/MWh) and always-INC earns +$2.09/MWh net at $0.30/MWh - profitable in every zone. Fitted models and a trailing-median timing rule do not beat that unconditional INC.
Separately: N.Y.C. is the highest-priced zone in the state over this window, consistent with an import-constrained load sink; perfect-foresight battery value scales more with duration than with zone; and on an illustrative three-bus network the cost of N-1 security is exact and vanishes once emergency ratings absorb the contingency. Gaussian 95% VaR is miscalibrated on the real N.Y.C. DART series.
1. Setup and market context
The question this note answers is whether a simple virtual bid on NYISO's day-ahead versus real-time zone prices was profitable under walk-forward discipline on H1 2026, and what else the same panel implies for storage value and grid security. NYISO is a useful single-ISO case: LMP is published with energy, congestion, and loss components in the same file; history is free and deep; and the load file carries an explicit standard-time / daylight-time column, which matters once a panel has to survive a clock change without mislabeling an hour.
Mean day-ahead and real-time prices by zone over the full six months, highest to lowest:
| Zone | Mean DA price | Mean RT price | Mean congestion (DA) |
|---|---|---|---|
| N.Y.C. | $82.66 | $76.43 | +$1.31 |
| DUNWOD | $82.33 | $75.83 | +$1.15 |
| MILLWD | $82.00 | $75.44 | +$1.07 |
| HUD VL | $81.39 | $74.81 | +$0.92 |
| CAPITL | $80.93 | $74.70 | +$1.04 |
| MHK VL | $79.57 | $72.75 | +$0.33 |
| LONGIL | $77.54 | $73.78 | -$3.43 |
| NORTH | $77.21 | $70.73 | +$0.14 |
| CENTRL | $76.08 | $70.26 | +$0.46 |
| GENESE | $71.18 | $65.20 | -$1.45 |
| WEST | $66.91 | $58.65 | -$3.34 |
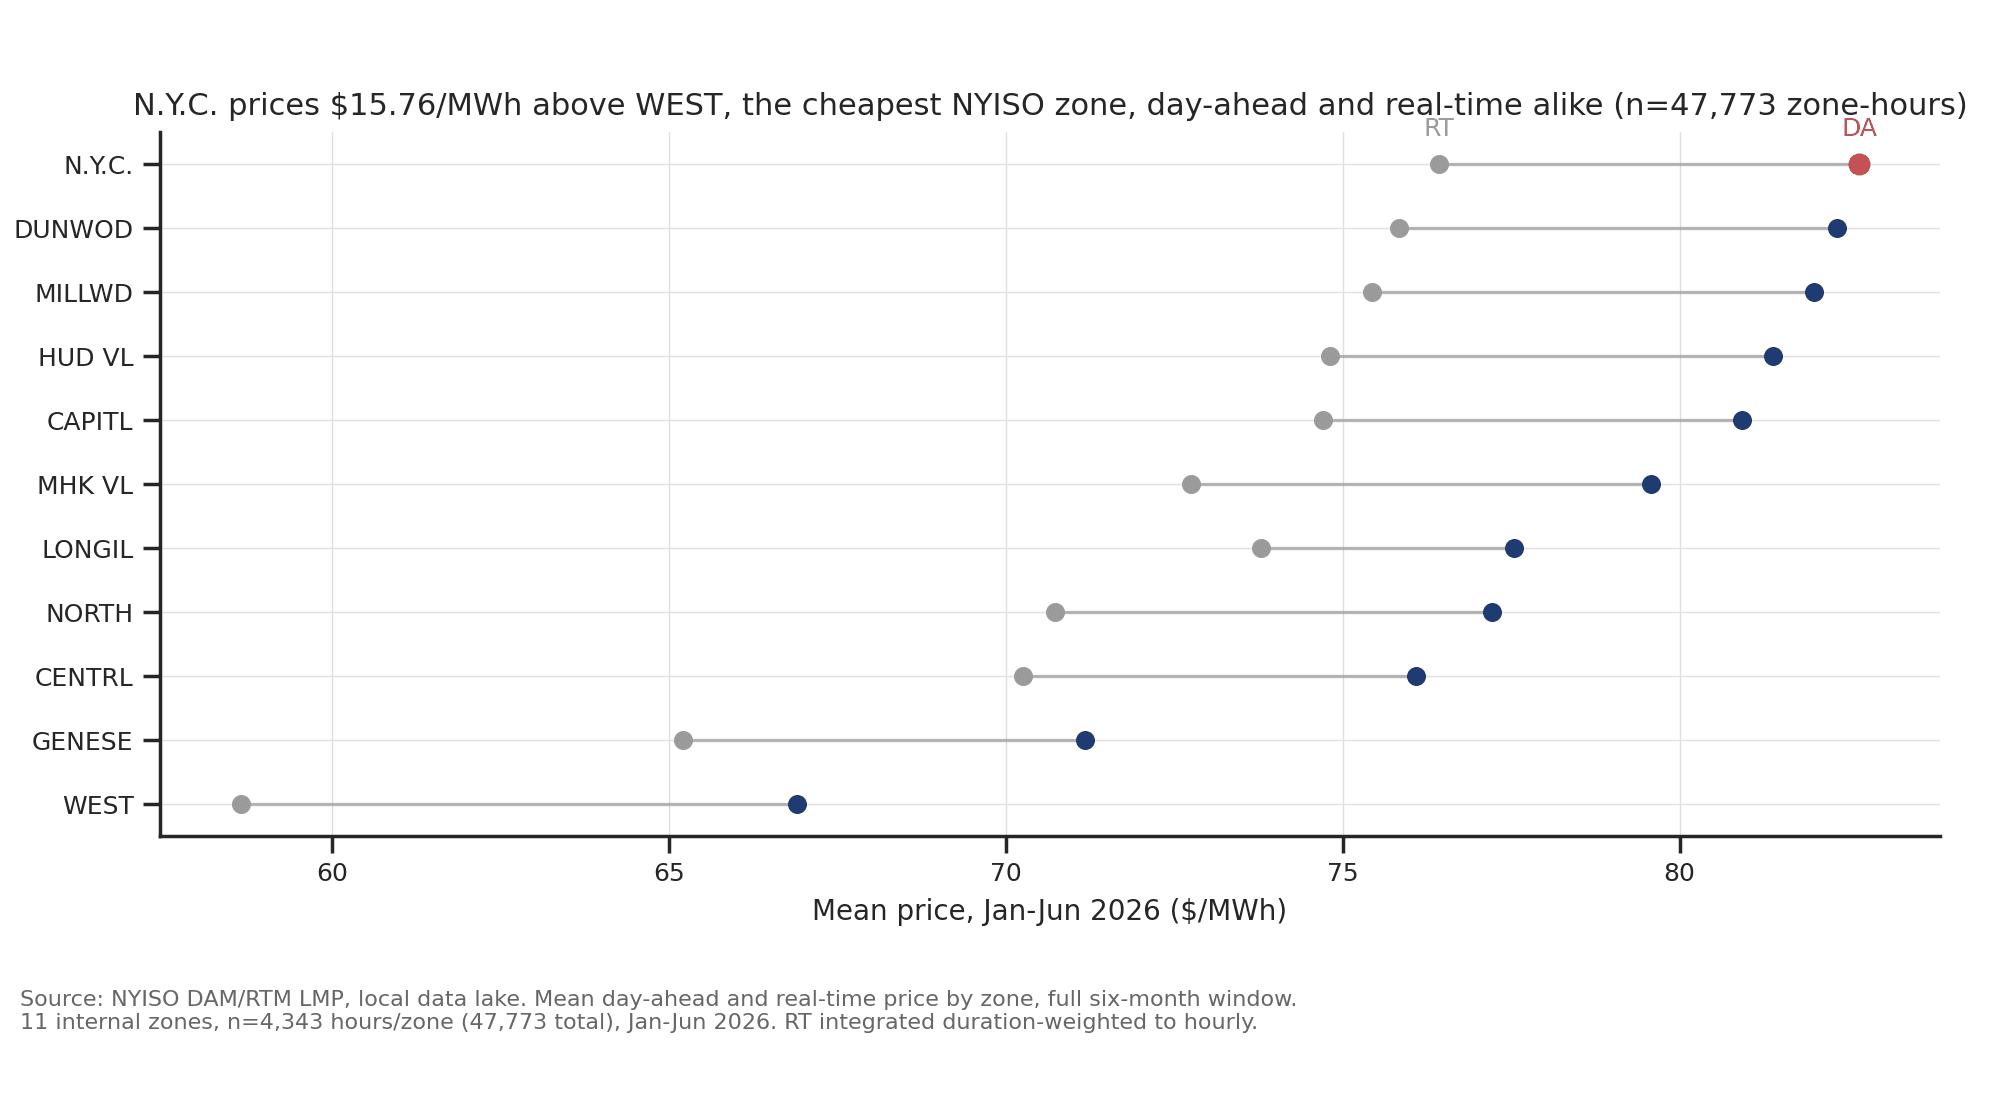
N.Y.C. prices highest of all 11 NYISO zones, day-ahead and real-time alike.
$15.76/MWh above WEST, the cheapest zone, over the full six-month window.
N.Y.C. is the most expensive zone on average, $15.76/MWh above WEST, with positive mean congestion day-ahead and real-time (+$1.31, +$2.19/MWh). WEST is strongly negative (-$3.34/MWh day-ahead). In the sign convention used here, positive congestion means a binding transmission constraint is raising the nodal price - the signature of an import-constrained sink. That convention was recovered from the raw NYISO file: undoing the published-sign flip disperses the implied system reference price by more than $10 against a 3-cent rounding tolerance. Four of the five most expensive zones sit downstate; the five cheapest sit upstate. Long Island is the exception: geographically downstate, but with negative mean congestion, so its constraints are not explained by distance from Manhattan alone.
2. Data and scope
Panel: day-ahead and real-time locational marginal prices (energy, congestion, loss) and load for all 11 NYISO internal load zones, 2026-01-01 through 2026-06-30. After joining day-ahead hours to duration-weighted integrated real-time prices1, the panel has 47,773 zone-hours (65,145 day-ahead hours per zone-set before join filters; zero dropped for missing real-time or load; minimum coverage 1.0 on retained hours). External proxy PTIDs (HQ, NPX, PJM, OH) are excluded.
Weather for the same zones and window: 96,096 rows of ERA5-family reanalysis actuals plus a two-day-ahead archived forecast, both at full coverage. Forecast versus realized temperature differs by a mean 1.64°C (median 1.2°C, max 15.7°C) across the aligned panel - a real forecast, not the outcome relabeled. The two-day lead is the shortest whose issue time can be shown to precede NYISO's day-ahead bid deadline under every model run hour2.
All results below are wholesale. No retail tariffs. Transmission topology and generator fleet data are not in the lakehouse (ISOs do not publish line parameters in open form); Section 9 is therefore an illustrative network with a real solver, not a claim about NYISO topology.
3. The DART spread: full sample vs. out of sample
The DART spread is DA - RT: the payoff to a virtual supply (INC) that sells day-ahead and buys back real-time. A DEC earns the opposite. No physical delivery. Across the full 47,773 zone-hours the spread averages +$6.29/MWh (median +$2.42, std $70.45; 59.6% of hours DA > RT). The mean is 2.6 times the median - the edge is in a thin right tail, not a typical hour.
That full-sample mean is not uniform across the window. Monthly unconditional INC at a $0.30/MWh fee:
| Month | n | Mean DART | Net P&L @ $0.30 | Hit rate |
|---|---|---|---|---|
| January | 8,184 | +$38.37 | +$38.07 | 62.0% |
| February | 7,392 | +$2.37 | +$2.07 | 59.0% |
| March | 8,173 | -$1.41 | -$1.71 | 59.0% |
| April | 7,920 | -$0.93 | -$1.23 | 52.6% |
| May | 8,184 | -$0.08 | -$0.38 | 59.0% |
| June | 7,920 | -$1.44 | -$1.74 | 58.1% |
| Full sample | 47,773 | +$6.29 | +$5.99 | — |
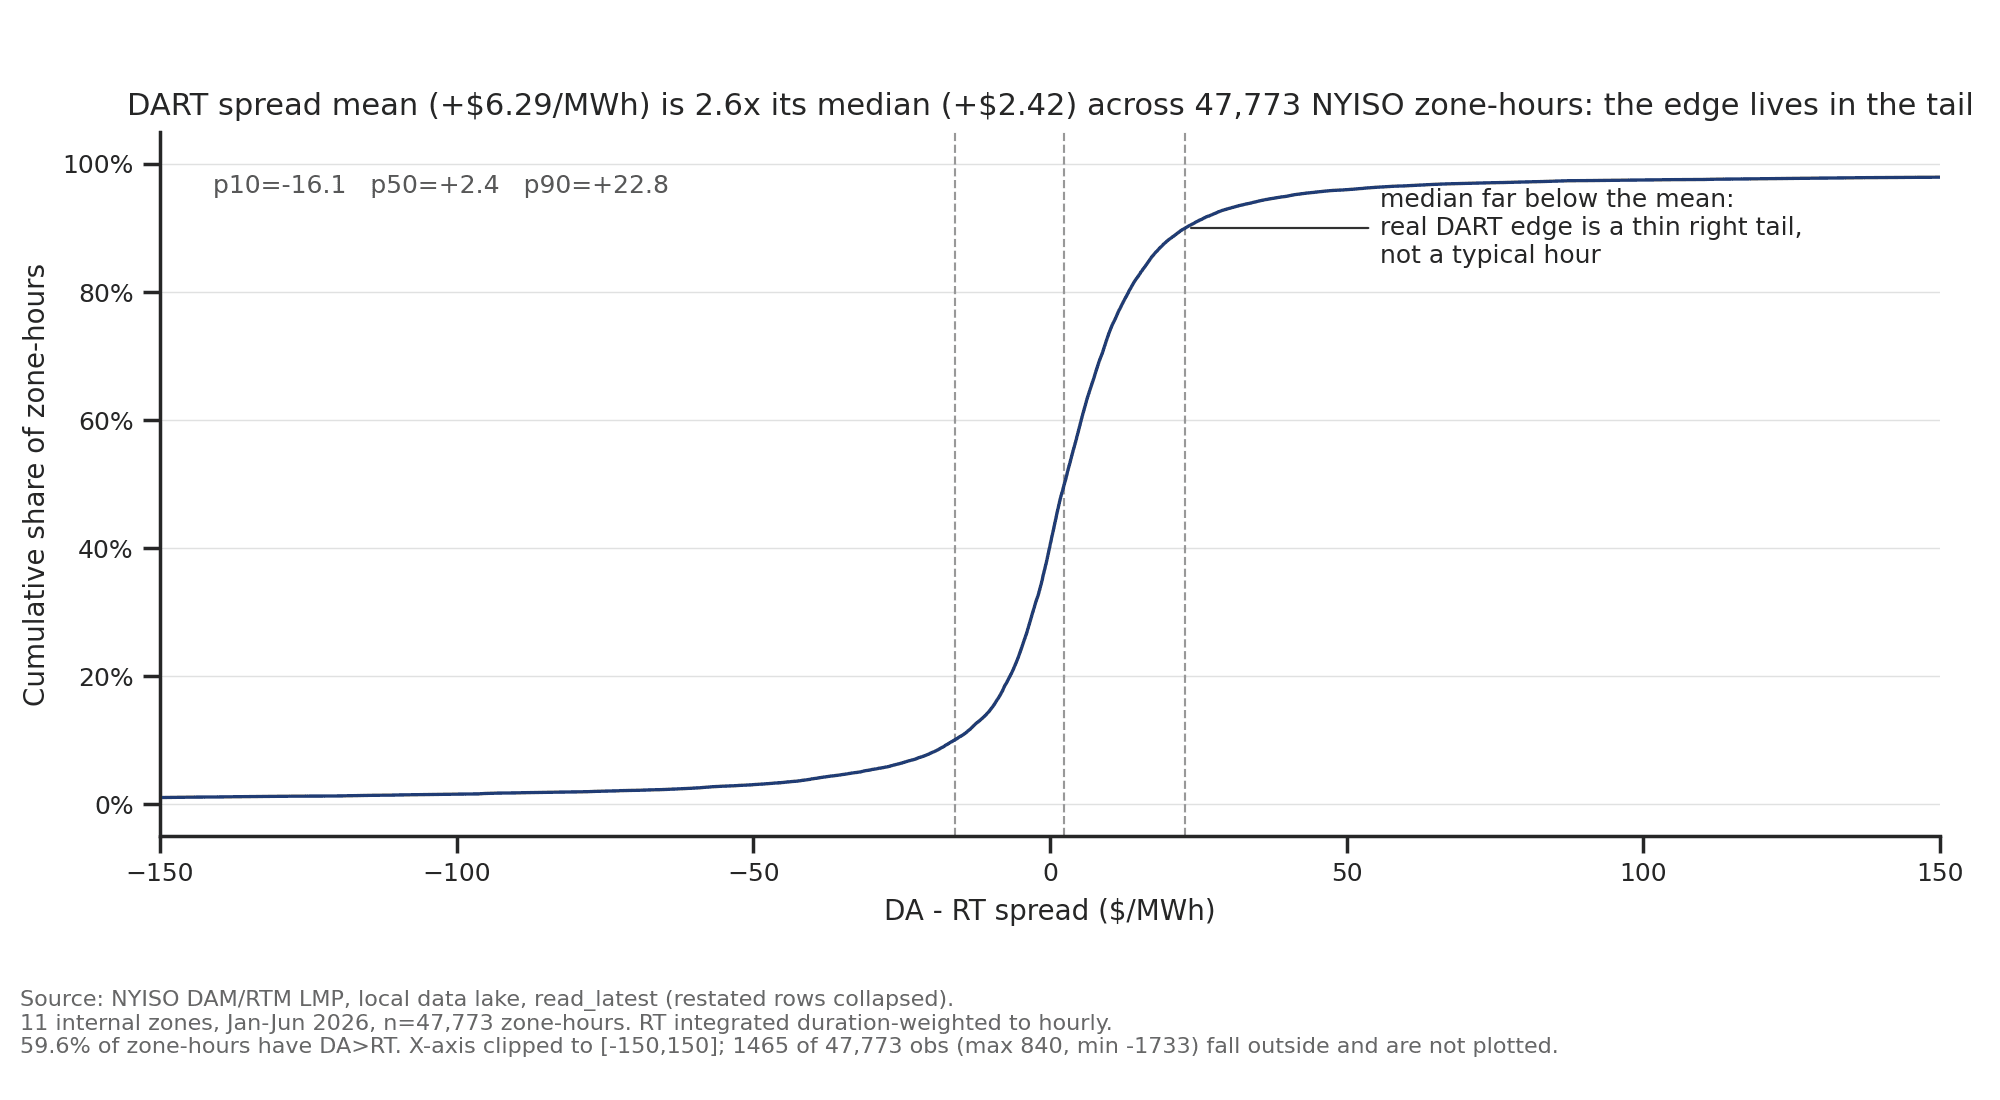
DART spread mean is 2.6x its median across 47,773 zone-hours.
The edge lives in a thin right tail, concentrated in January.
January alone accounts for most of the full-sample edge. On the full panel, always-INC at $0.30/MWh earns +$5.99/MWh. A $0.30 fee against a $6.29 mean is a small haircut, not the reason a trade would fail.
Walk-forward evaluation is the right test for a strategy that would be retrained over time. Expanding-window folds with a minimum train of ~28 zone-days (feature warmup for the 28-day rolling terms) leave 40,381 zone-hours out of sample. On that OOS set the mean DART is +$2.39/MWh (median +$2.22, 59.4% positive). The train-only block that never enters a test fold still carries a much higher mean (+$27.62), because it is almost entirely early January. Strategy P&L below is always measured on the OOS window, never on the full-sample mean.
An earlier revision of this study used min_train = 35% of the panel (~63 calendar days). That permanently excluded all of January from every test fold, left an OOS mean of -$0.87/MWh, and made every rule look broken next to the full-sample +$6.29 figure. That was an evaluation defect, not a market fact: once late January is allowed into OOS, unconditional INC is profitable.
Two further caveats on inference. Zone-hours are not independent: mean pairwise cross-zone DART correlation is about 0.95, because the system energy component is common. Pooled t-statistics over 11 zones overstate independent sample size by roughly a factor of 11; mean P&L per MWh remains a valid per-zone economic figure. And a six-month window with one extreme winter month is a thin basis for any claim about long-run virtual profitability.
4. Forecasting the spread
Features respect NYISO's bid deadline: a bid for operating day D is due 05:00 Eastern on D-1, before D-1 real-time has finished, so the most recent complete real-time observation is D-2. The primary feature set is small on purpose - 27 columns over roughly 4,300 hours per zone - with lagged price and load terms as zone-hour deviations from a trailing 28-day mean, calendar terms, and nine weather terms: two-day-ahead forecast temperature, wind speed and cloud cover with the temperature degree-hour transforms, plus realized temperature, wind speed, dewpoint, and cloud cover at the two-day lag, each as a deviation from its own trailing 28-day mean. Fuel-mix and Henry Hub features were also tested after detrending; they did not improve OOS economics.
Models: quantile (median) regression, ridge with nested alpha selection, Huber, plus two fit-free baselines (trailing median of DART at the same zone-hour over the prior 28 admissible days, and always-INC). Walk-forward with purged and embargoed folds3, six folds. All models are scored on the same 40,381 OOS hours; a NaN prediction is treated as a flat (no trade), not as a dropped row. Directional accuracy against the majority-class base rate (~59.5%):
| Model | n OOS | Accuracy | vs. base rate | Spearman IC | Net $/MWh @ $0.30 |
|---|---|---|---|---|---|
| Always-INC | 40,381 | 59.5% | 0.0% | n/a | +$2.09 |
| Trailing median | 40,381 | 57.0% | -2.5% | +0.126 | +$0.99 |
| Huber | 40,381 | 57.9% | -1.1% | -0.008 | -$0.82 |
| Ridge (nested) | 40,381 | 57.6% | -1.5% | -0.013 | -$1.06 |
| Quantile (median) | 40,381 | 56.2% | -2.8% | -0.072 | -$1.04 |
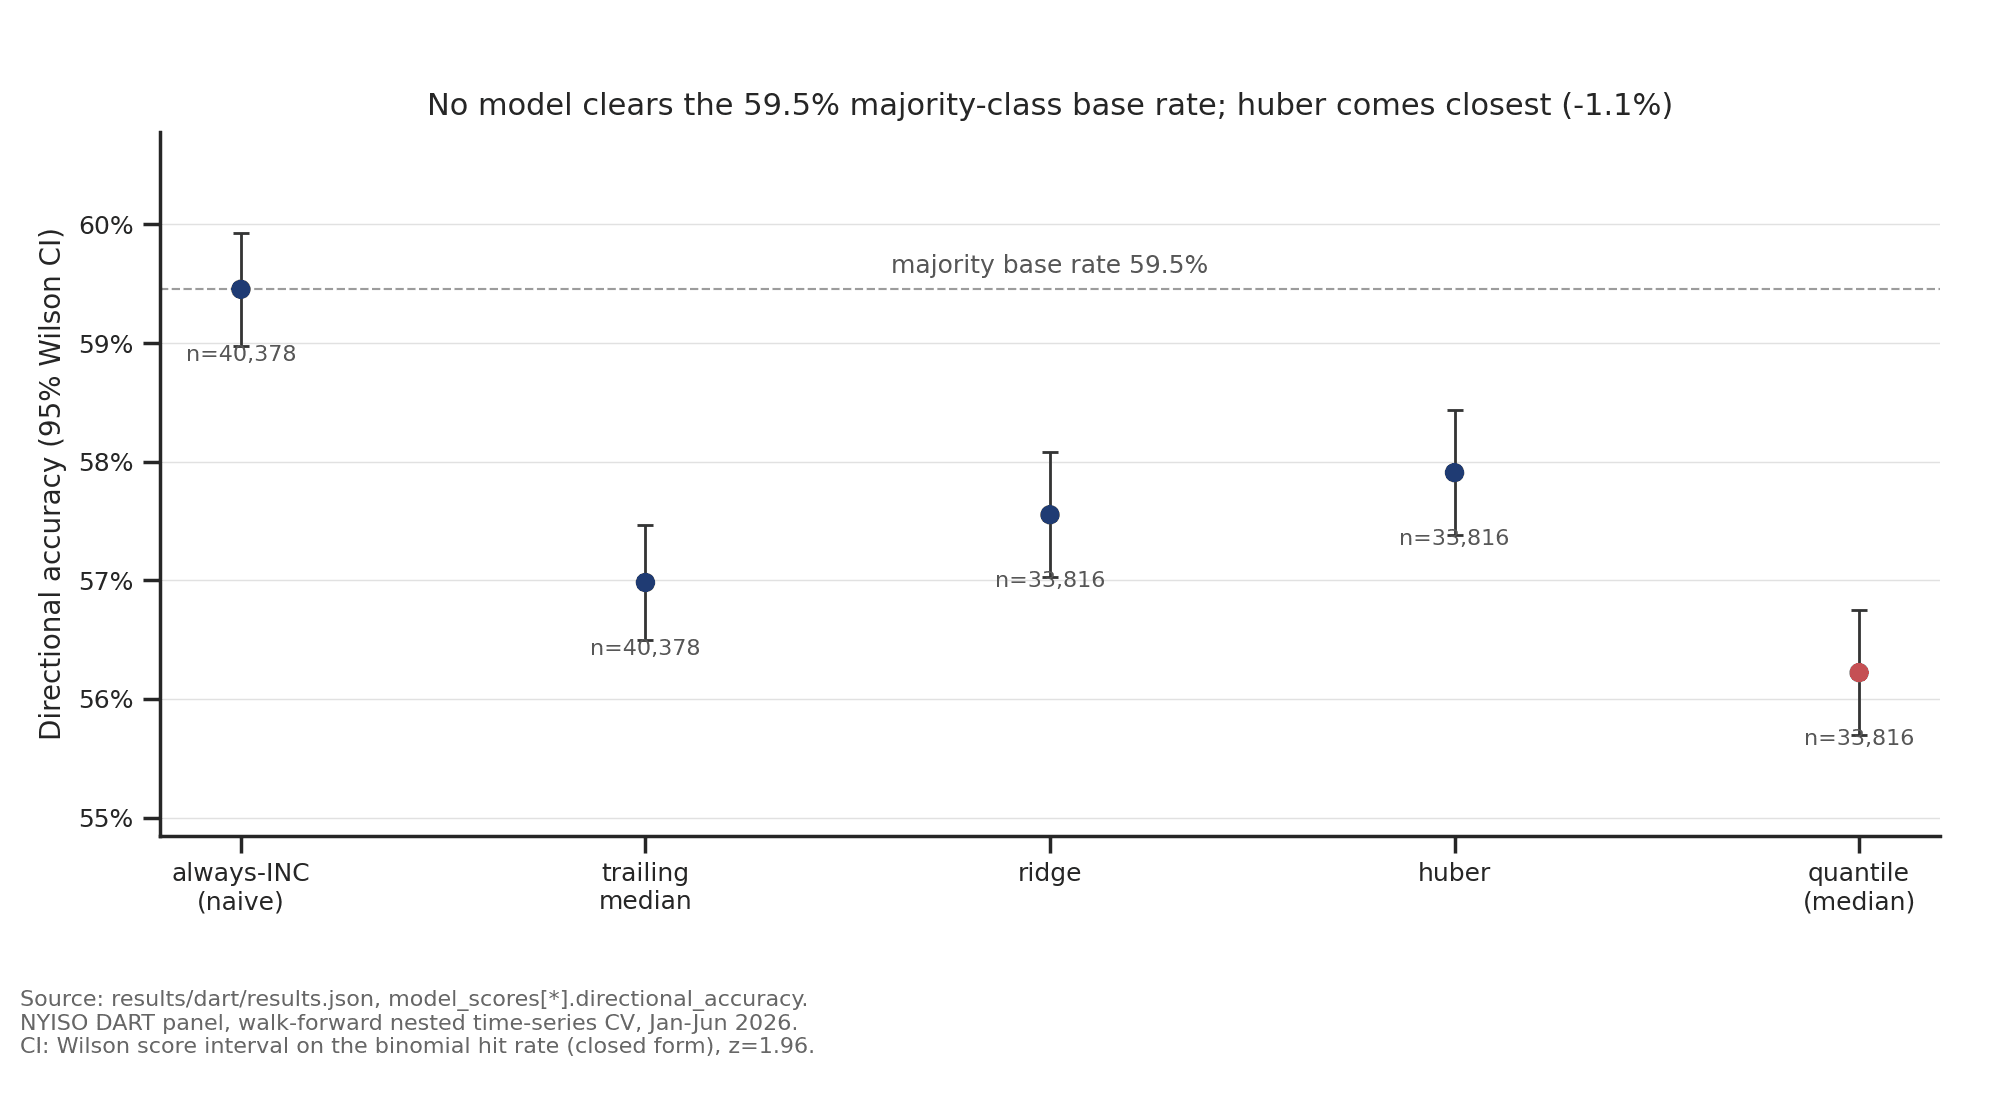
No fitted model clears the naive always-INC base rate on direction.
Always-INC also wins on OOS P&L; timing rules and linear models lag.
None of the fitted models beats always-INC on direction or on dollars. The trailing median has the highest Spearman IC (+0.13) among active rules but still underperforms always-INC on P&L: rank correlation without correct sizing of the large moves is not an edge. The most train/test-displaced feature is a weather degree-hour term in five of six walk-forward folds (standardized displacement 1.36-2.20) and the rolling 28-day DART mean in the earliest, thinnest-training fold (7.25); that is expected when folds span seasons, and is a reason to discount coefficients out of season rather than treat them as stable.
5. Strategy economics
The economically best simple rule on this OOS window is always-INC. Fee sweep from $0.00 to $1.00 per MWh of virtual volume (OOS, always-INC, 40,381 zone-hours):
| Fee ($/MWh) | Mean P&L ($/MWh) | Hit rate | t-stat | Sharpe |
|---|---|---|---|---|
| 0.00 | +2.39 | 59.4% | +12.03 | +5.61 |
| 0.10 | +2.29 | 59.0% | +11.53 | +5.37 |
| 0.30 | +2.09 | 58.1% | +10.52 | +4.90 |
| 0.50 | +1.89 | 57.2% | +9.51 | +4.43 |
| 1.00 | +1.39 | 54.9% | +7.00 | +3.26 |
The $0.30 central assumption is a modeling choice, not a measured tariff: published NYISO rate-schedule components are roughly $0.10-0.20/MWh; the rest is execution cost that is desk-specific and not public. At that fee, OOS always-INC is +$2.09/MWh. Trailing-median timing is +$0.99/MWh - still positive, but worse than always taking the long-run side. Fitted models land around -$0.82 to -$1.06/MWh: they switch sides enough to destroy the unconditional edge without capturing a better one.
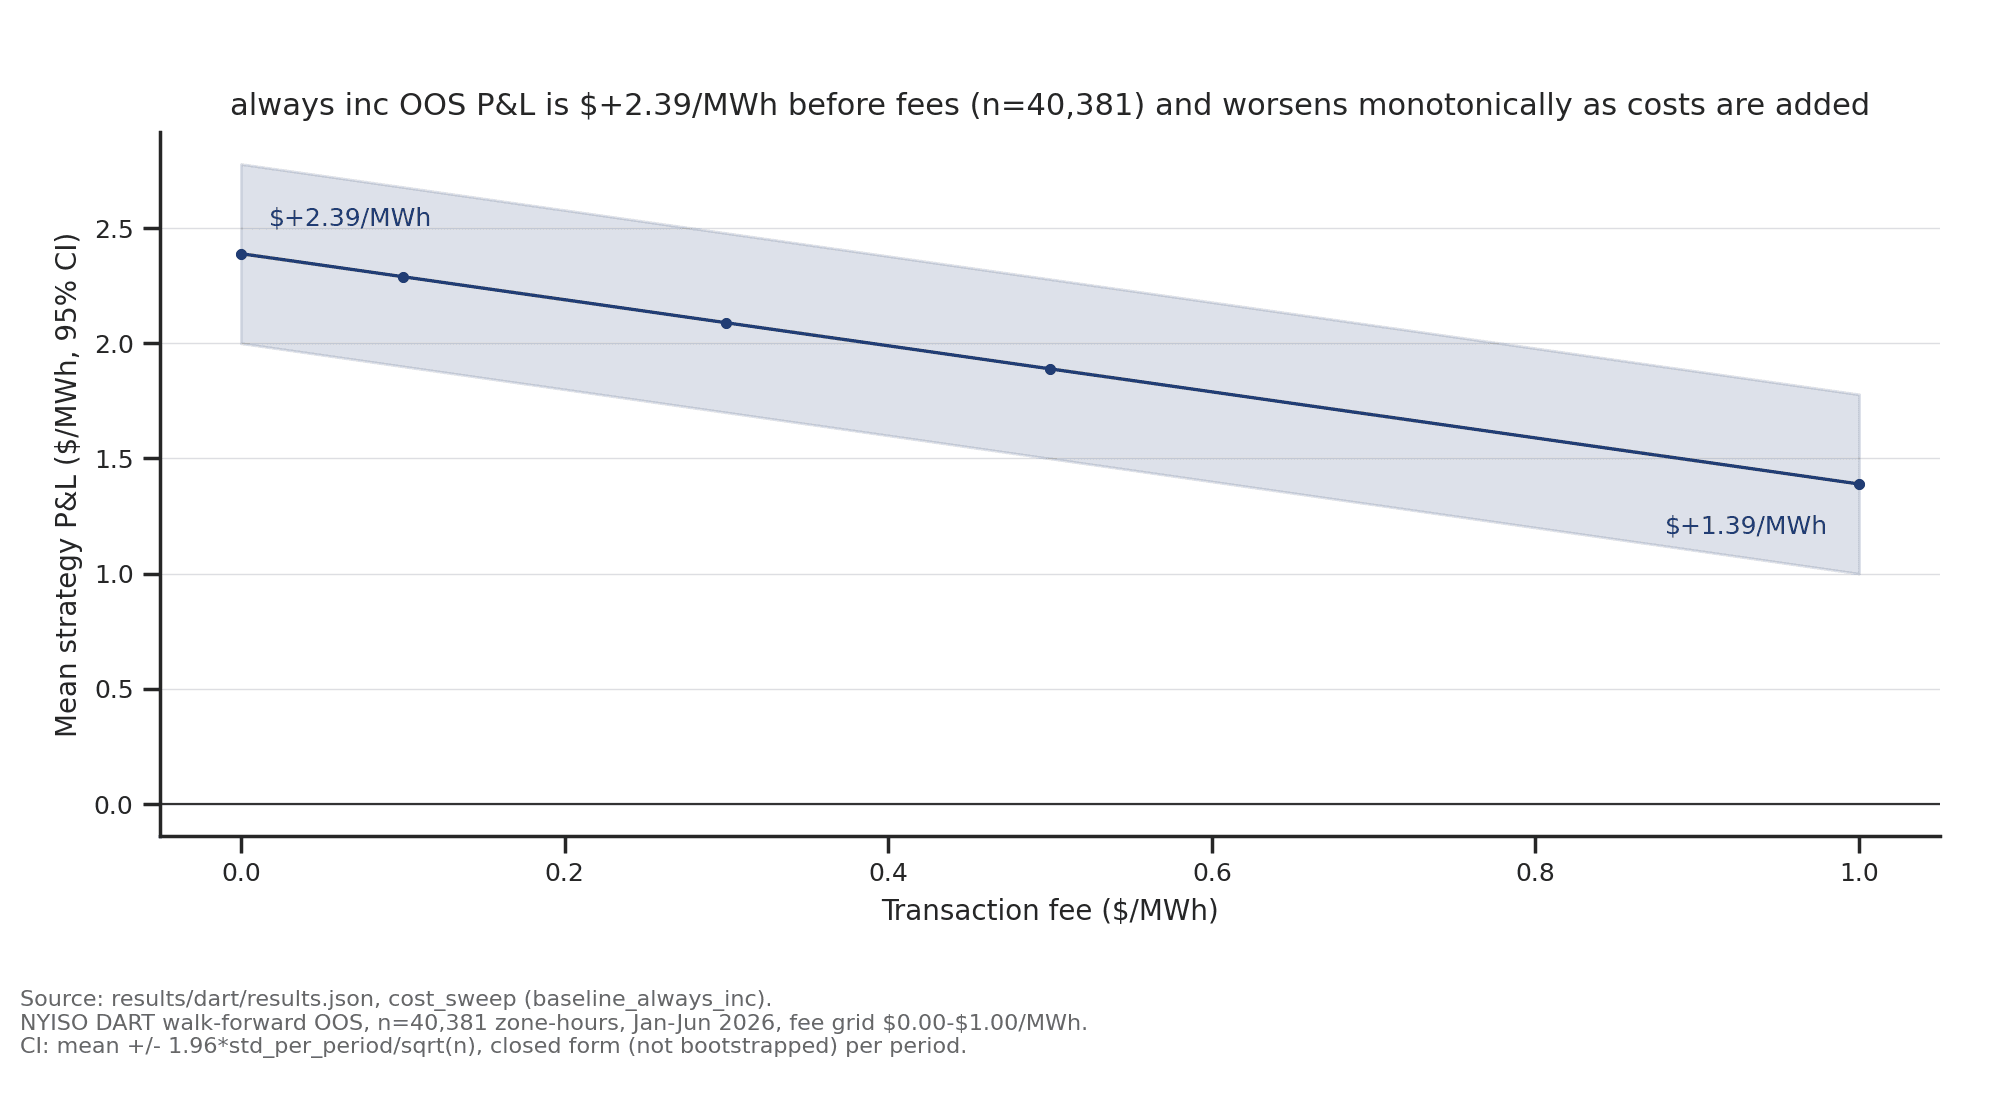
Always-INC remains profitable across the fee grid on the OOS window.
+$2.39/MWh at zero fee to +$1.39/MWh at $1.00/MWh; n=40,381 OOS zone-hours.
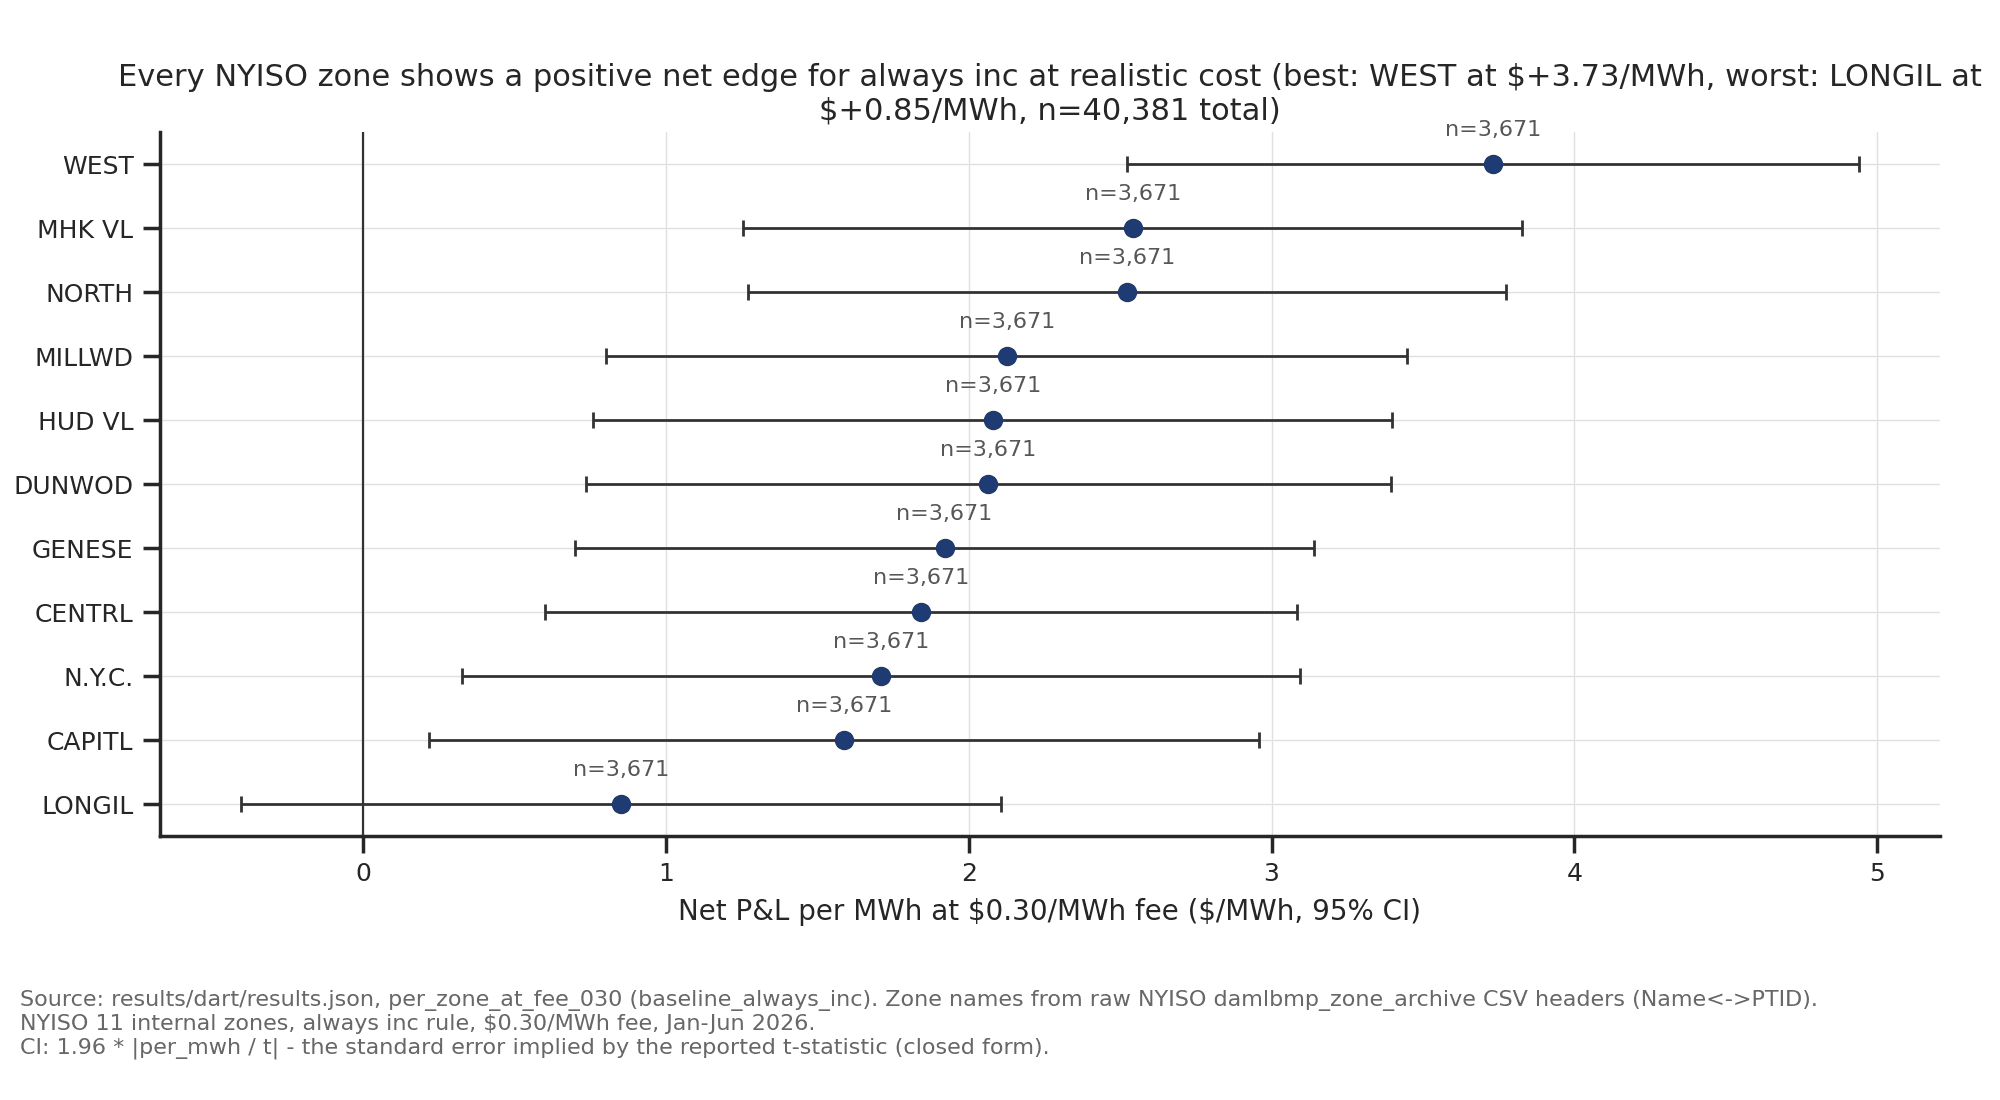
OOS always-INC is net-positive in every NYISO load zone at $0.30/MWh.
Best zone WEST +$3.73/MWh; worst LONGIL +$0.85/MWh.
Per-zone OOS always-INC at $0.30 is positive everywhere: WEST +$3.73/MWh, LONGIL +$0.85/MWh. The edge is not one lucky zone. Convergence-bidding literature has often found that measured profits shrink to the size of transaction costs once costs are applied carefully (Jha & Wolak 2019 on CAISO; Birge et al. 2020; Hogan 2016)4. On this NYISO window and fee assumption, unconditional INC still clears costs; the open question is whether the January-heavy edge persists outside H1 2026, not whether a $0.30 fee alone kills a $6 mean.
6. VaR calibration
Two rolling, point-in-time 95% VaR models - closed-form Gaussian and empirical-quantile historical, each on a trailing 200-observation window using only prior data - backtested on the N.Y.C. zone DART series (4,143 observations):
| VaR method | Observed breach rate | Expected | Kupiec LR | p-value | Calibrated? |
|---|---|---|---|---|---|
| Parametric (Gaussian) | 3.9% | 5.0% | 12.22 | 4.74e-04 | No |
| Historical | 6.2% | 5.0% | 12.23 | 4.70e-04 | No |
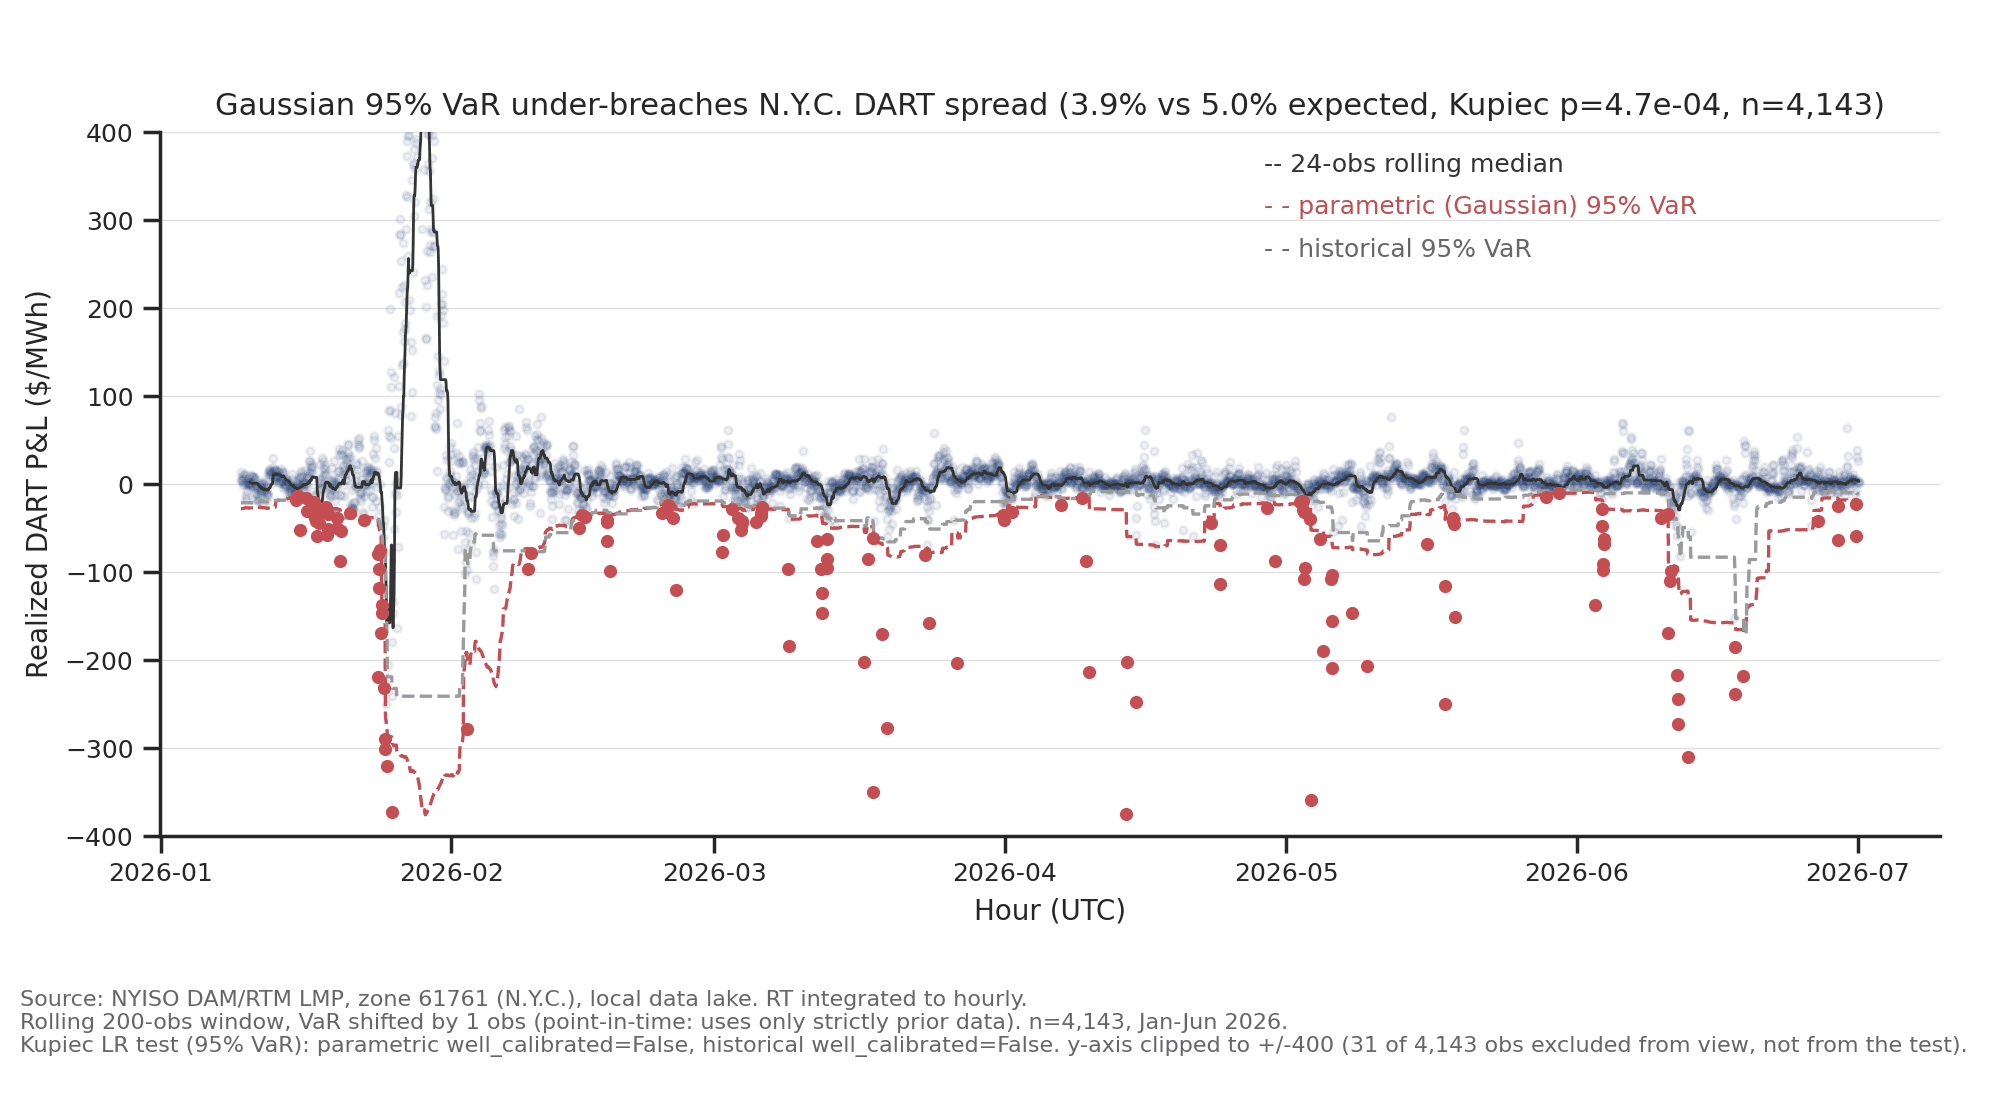
Gaussian 95% VaR is miscalibrated on real DART tails - too conservative.
3.9% observed breach rate vs. 5.0% expected; Kupiec p=4.7e-04.
Both fail the Kupiec proportion-of-failures test at 5%. Gaussian VaR is too conservative (3.9% breaches vs. 5.0% target), which wastes capital. Historical VaR overshoots the other way (6.2%). Both sit about 1.1-1.2 percentage points from target on opposite sides; neither is an acceptable default for this series without adjustment.
7. Battery arbitrage bounds
Perfect-foresight arbitrage value for a 1 MW battery, re-optimized each operating day with cyclic state of charge and 85% round-trip efficiency, summed over the six-month window. Upper bound on revenue, not a realizable strategy:
| Zone | 2h ($k/MW) | 4h ($k/MW) | 8h ($k/MW) |
|---|---|---|---|
| N.Y.C. | 29.95 | 41.44 | 49.97 |
| LONGIL | 28.23 | 40.30 | 49.70 |
| HUD VL | 28.90 | 40.19 | 48.39 |
| CAPITL | 28.94 | 40.10 | 47.77 |
| DUNWOD | 28.72 | 40.00 | 48.22 |
| MILLWD | 28.47 | 39.66 | 47.76 |
| MHK VL | 28.17 | 39.52 | 47.55 |
| CENTRL | 27.17 | 38.22 | 46.02 |
| NORTH | 27.44 | 38.35 | 45.84 |
| GENESE | 25.43 | 35.32 | 41.91 |
| WEST | 25.18 | 34.16 | 39.67 |
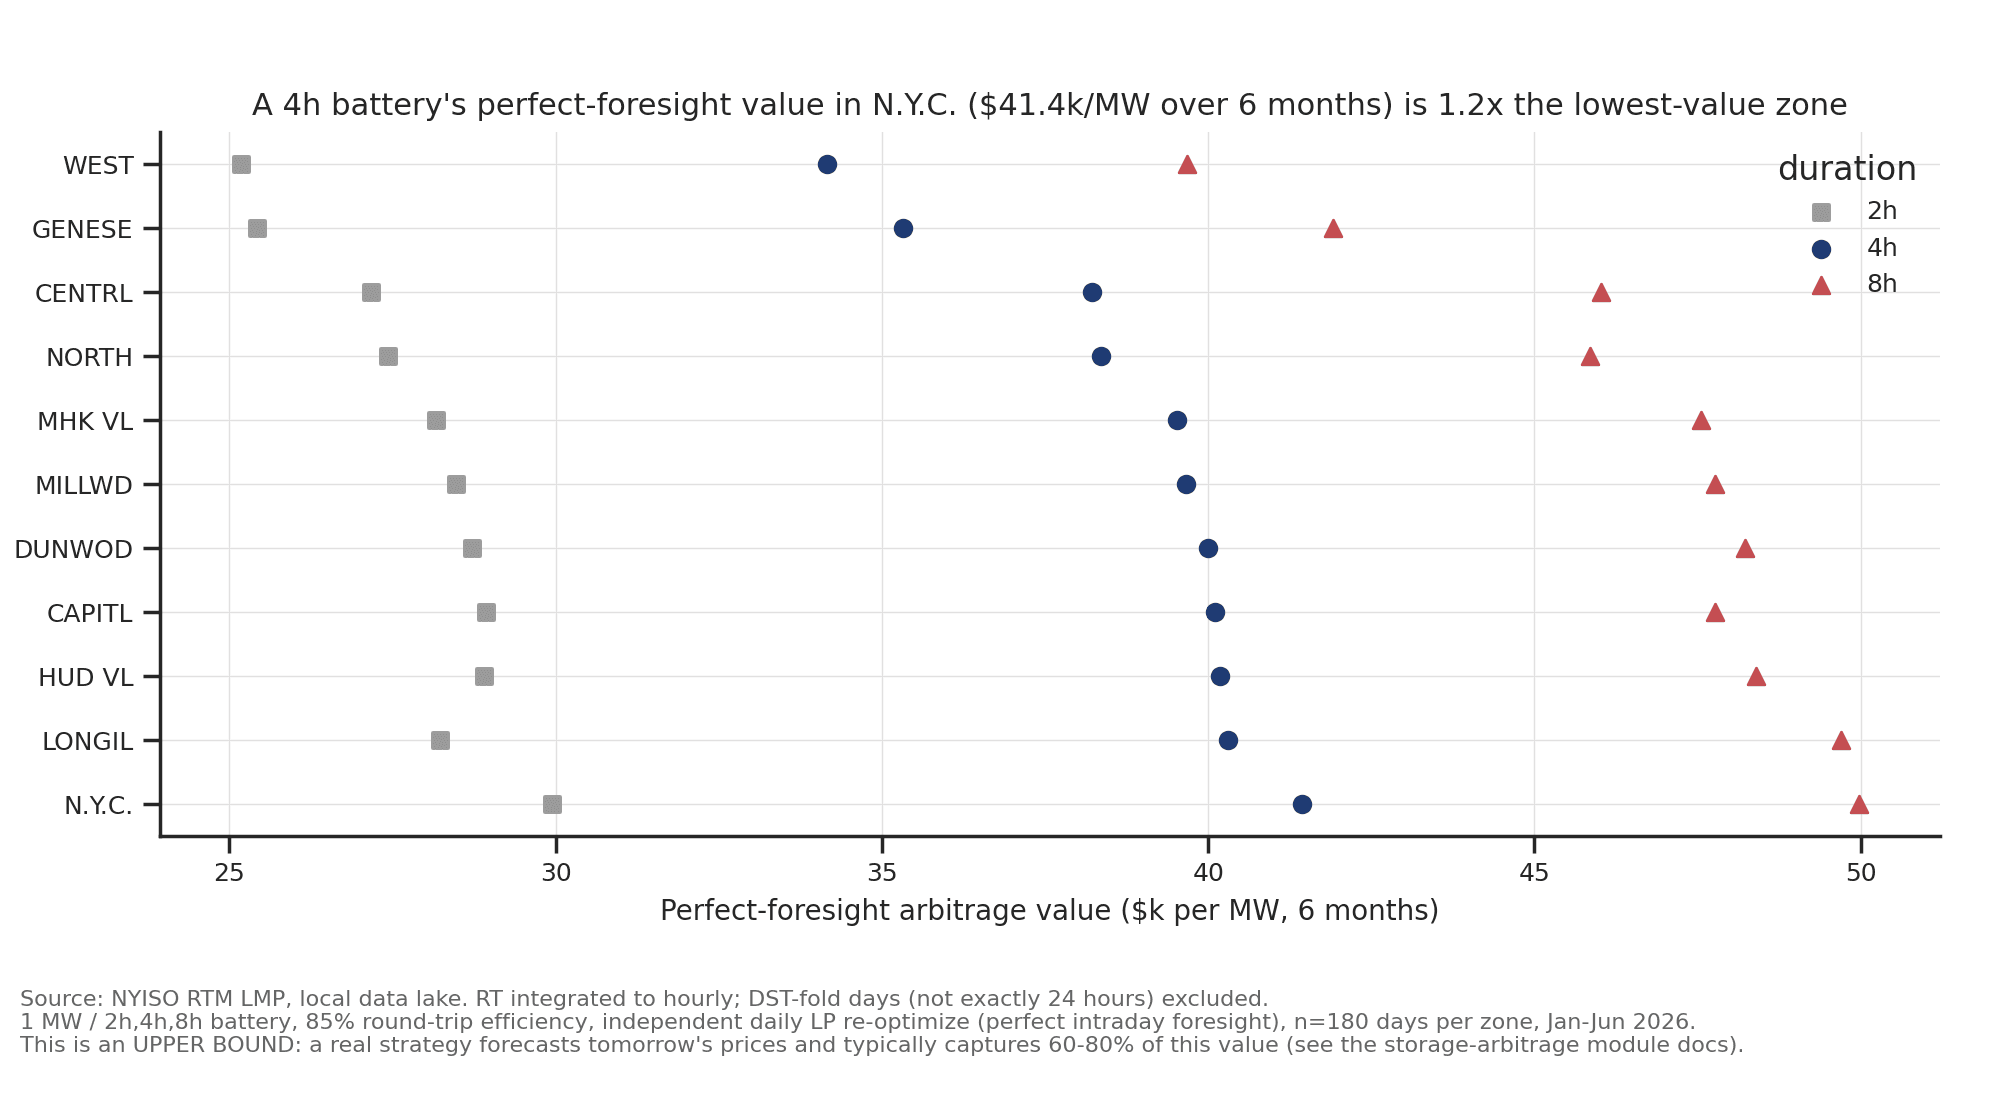
Battery duration matters more than zone for perfect-foresight storage value.
Real NYISO RT prices; an upper bound, not a realizable revenue estimate.
Moving from 2h to 8h multiplies value by about 1.6-1.8x in every zone. N.Y.C. at 4h ($41.4k/MW) is only 1.2x WEST at 4h ($34.2k/MW). Duration dominates location under perfect foresight on this window. Literature estimates of forecast-based capture rates (CAISO DMM 2023; Sioshansi et al. 2009) are typically 60-80% of this upper bound; that range is external, not computed here.
A fixed calendar is a useful foil. Charging 10:00-18:00 and discharging the evening peak - a daytime-solar pattern built for markets like California - captures 0.3-10.8% of perfect foresight on N.Y.C. prices. N.Y.C.'s cheapest real hours are overnight (2:00-5:00, about $58-60/MWh), not midday ($67-76/MWh). A calendar fitted to that shape (charge overnight, discharge the 5 p.m. peak) reaches 23.9-34.8% of perfect foresight depending on duration, still well below a price-responsive strategy.
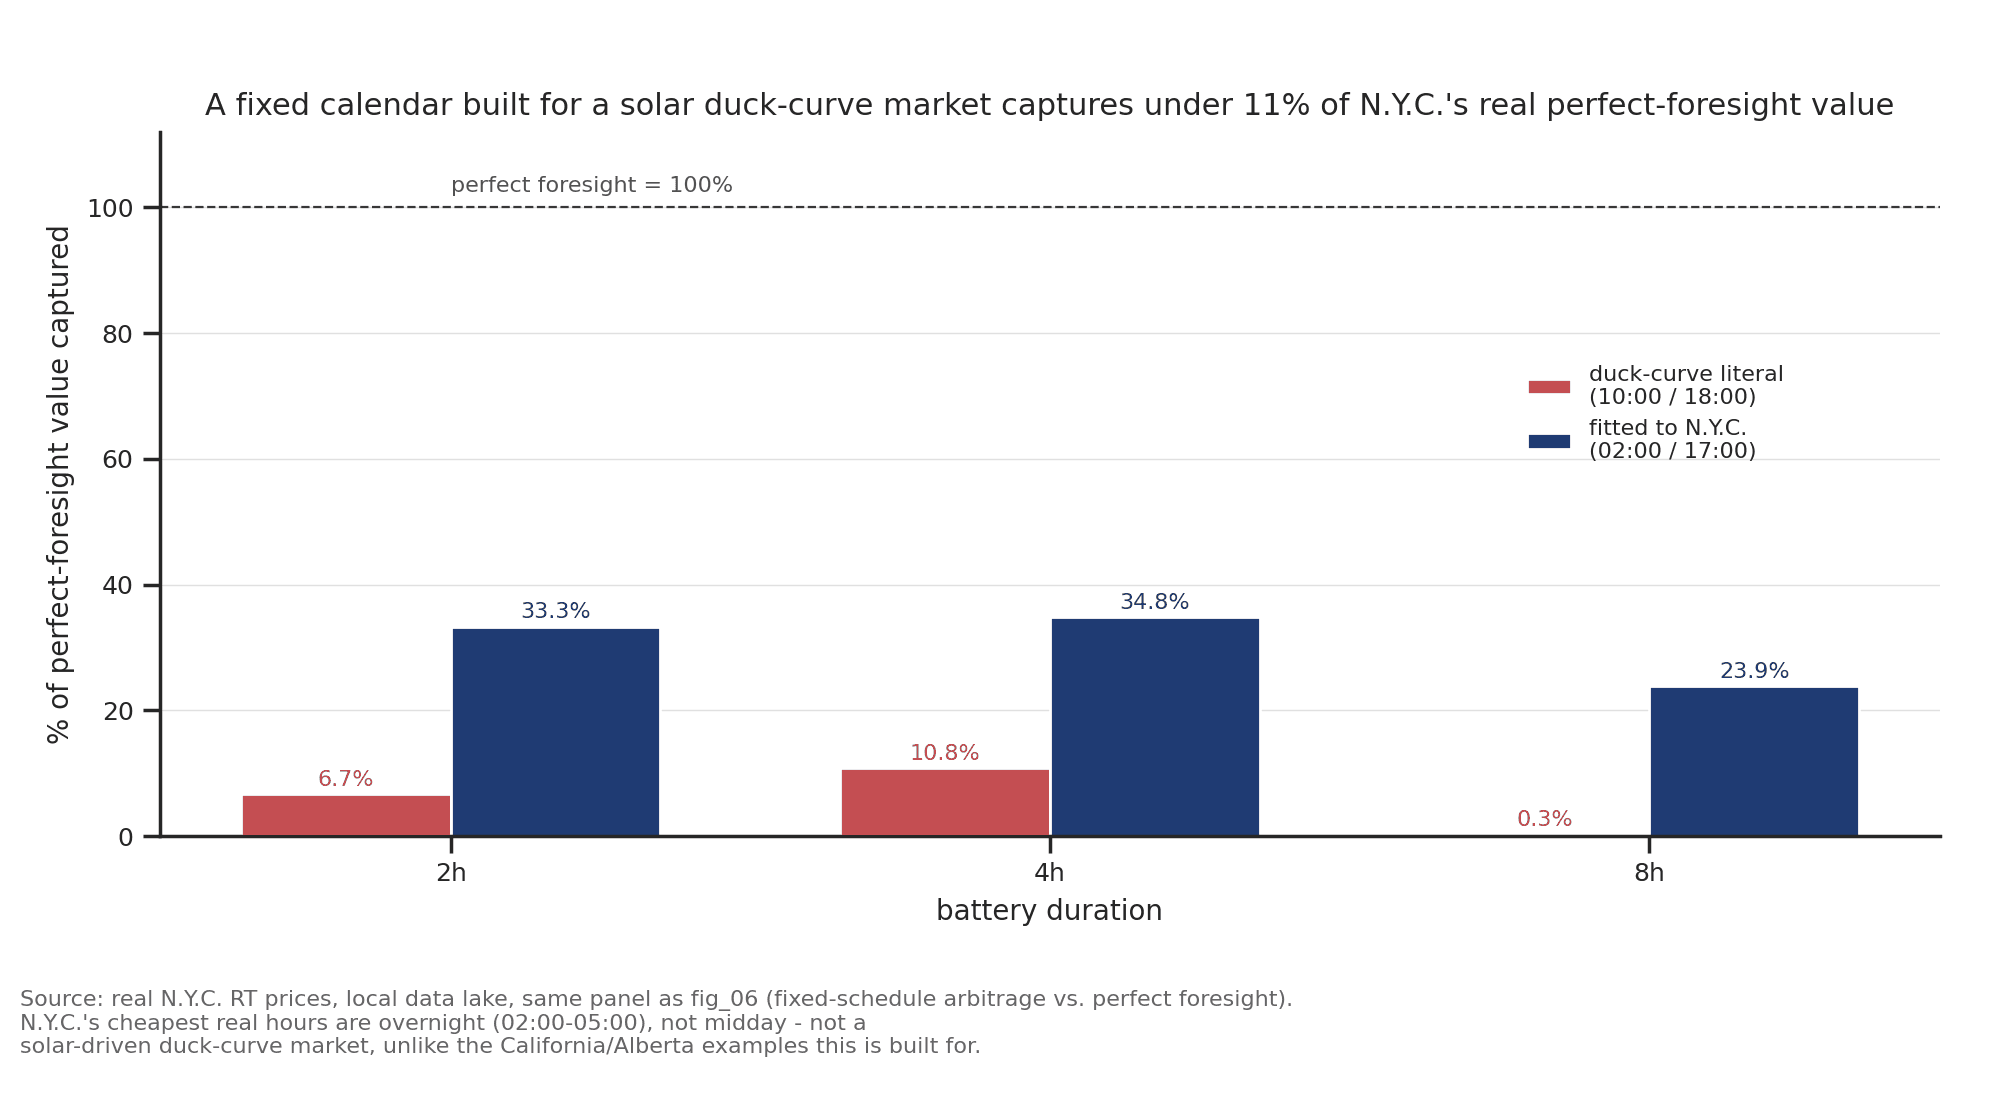
A literal fixed-calendar schedule captures under 11% of N.Y.C.'s perfect-foresight value.
A schedule fitted to N.Y.C.'s own price shape does better (23.9-34.8%), still far below a price-based strategy.
8. Additional model families
Section 4's result - no fitted linear model beats always-INC on this panel - is not rescued by more architecture. On roughly 4,300 hours per zone, deep sequence models (LSTM, small Transformer, TFT-style attention, NHiTS, PatchTST) and a geographic-proxy graph network were run under the same point-in-time lag rule. Directional accuracies on the N.Y.C. series: LSTM 59.5%, NHiTS 59.6% (majority-class collapse), Transformer 49.5%, TFT-style 51.9%, PatchTST 46.3%, GNN 55.0%, against a 59.6% base rate. None improves on the base rate in a way that would change Section 5. With this sample size that is the expected outcome: capacity is not the binding constraint; information and regime stability are.
Two secondary tools are more useful as diagnostics than as forecasters. A two-state HMM on N.Y.C. DART finds a calm regime (mean +$2.77/MWh, std $11.10, 87% of hours) and a volatile regime (mean +$27.85, std $199, 13% of hours), with the volatile share concentrated in January (31% of January hours) and declining through spring - the same monthly pattern as Section 3. A Student-t copula on cross-zone pairs fits better than a Gaussian at every pair tested, with degrees of freedom pinned at the edge of the search range: tail dependence across zones is extreme.
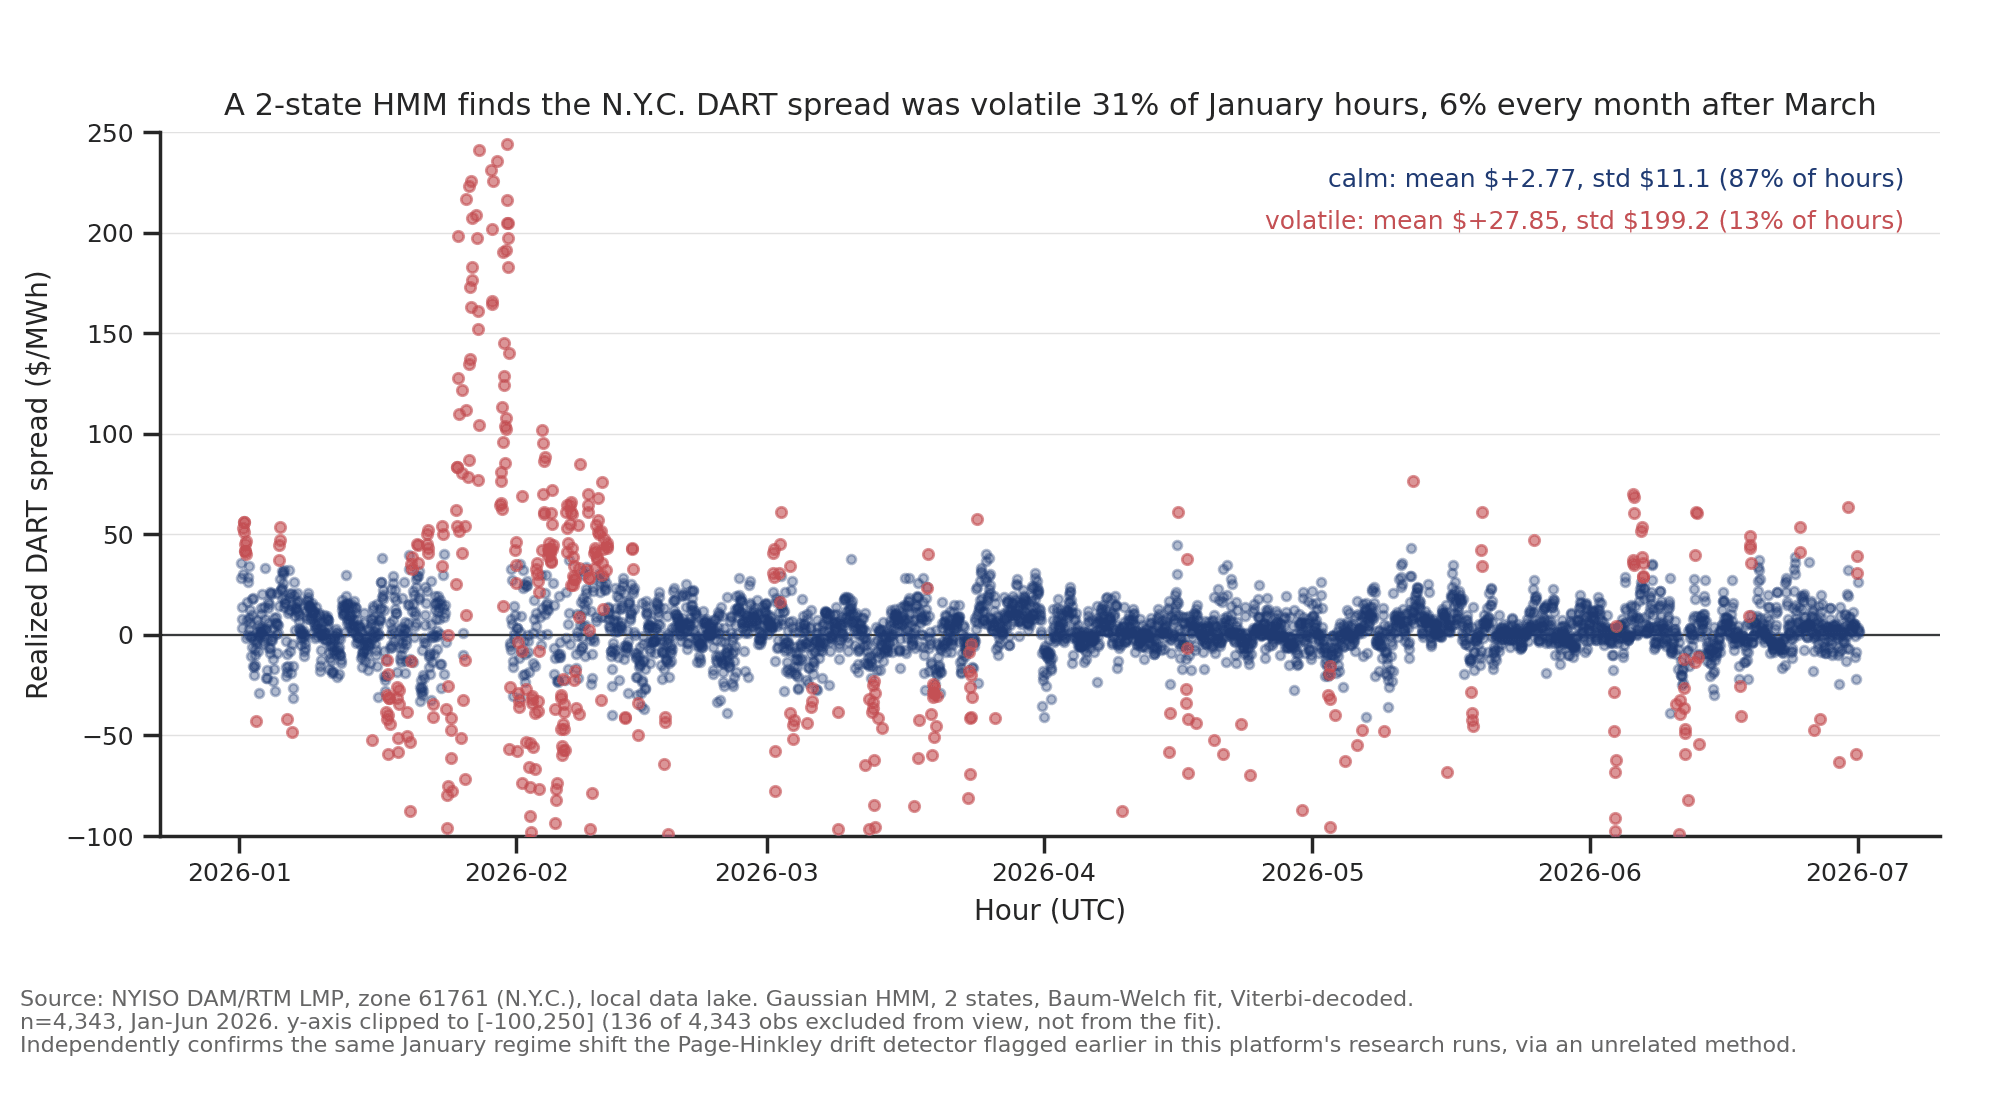
A 2-state HMM independently confirms the January 2026 volatility regime.
Calm regime 87% of hours, volatile regime 13%, concentrated in January.
9. Cost of N-1 security
Locational prices are the dual variables on nodal balance under transmission limits. On an illustrative 3-bus network (cheap $20/MWh generation at the slack bus, $60/MWh local backup, 150 MW load at each of the other two buses) - not real NYISO topology - unconstrained least-cost dispatch violates N-1: losing either of two lines pushes the survivor to 136.4% of emergency rating. Security-constrained dispatch removes the violation. Cost of security as a function of emergency rating:
| Emergency rating (MW) | Unconstrained cost | Secured cost | Security premium |
|---|---|---|---|
| 220 | $6,000 | $9,200 | $3,200 |
| 240 | $6,000 | $8,400 | $2,400 |
| 260 | $6,000 | $7,600 | $1,600 |
| 280 | $6,000 | $6,800 | $800 |
| 300 | $6,000 | $6,000 | $0 |
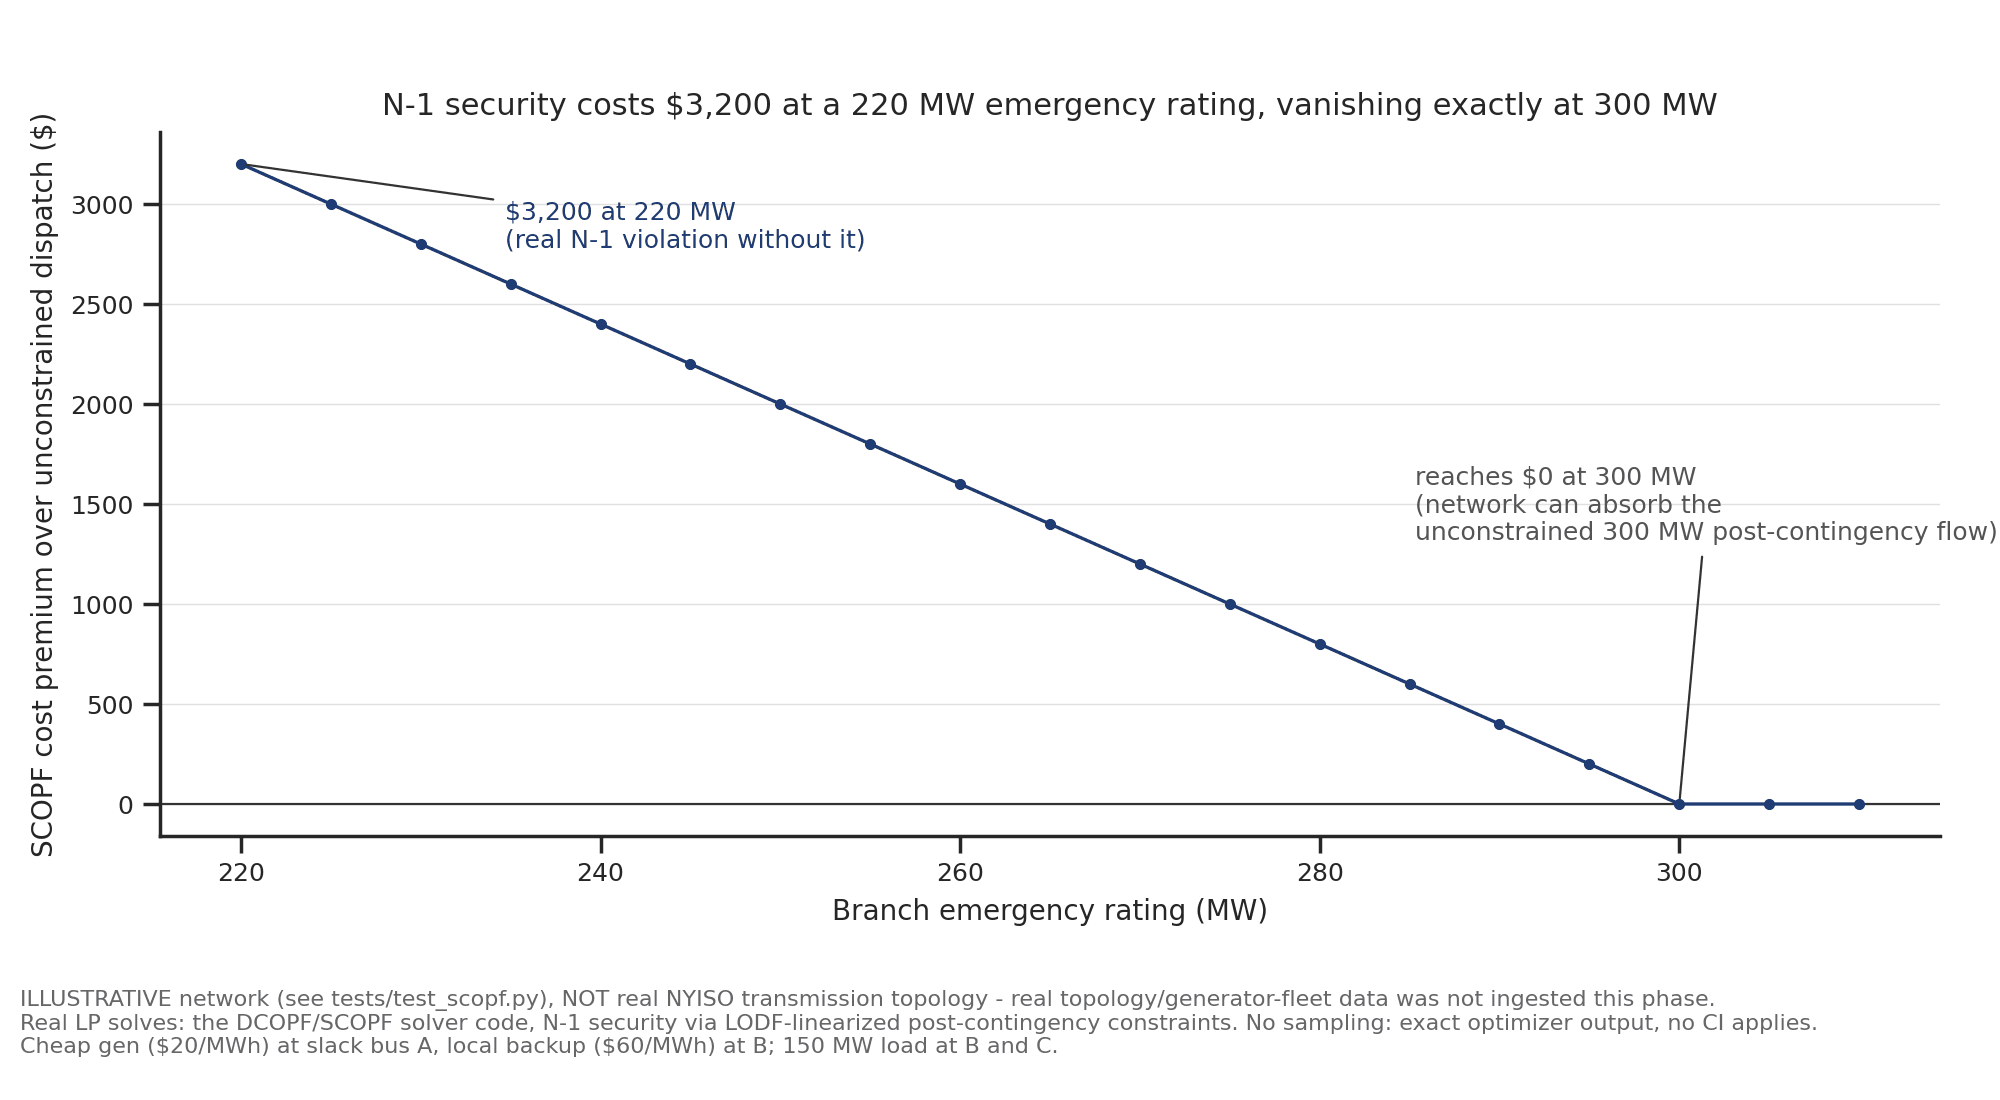
N-1 security has a real, exactly quantifiable cost - illustrative network.
$3,200 at a 220 MW emergency rating, vanishing exactly at 300 MW.
The premium is exactly $0 at 300 MW because that is the post-contingency flow the unconstrained dispatch already produces on the surviving line; the security constraint stops binding and the secured solution collapses onto the unconstrained one. Locational prices under the secured dispatch: $20 at the slack bus, $60 at both load buses - verified by finite-difference re-solves (raise load 1 MWh, re-solve, read the cost change) and by reduction of SCOPF to plain DC-OPF when the contingency set is empty. Congestion rent is $8,800, checked against its economic definition (load payments minus generator receipts) independently of the module's internal accounting.
Unit commitment on a two-unit, three-period example recovers a known non-monotonicity: a midday demand trough below a baseload unit's minimum load forces a shutdown and a later restart, so raising midday demand from 30 MW to 60 MW can cut total system cost ($10,450 for 330 MWh vs. $7,200 for 360 MWh). Both the MILP and a brute-force enumeration over on/off schedules agree. Continuous relaxation of the same problem understates true cost by 34% and, if rounded, recovers the wrong commitment schedule.
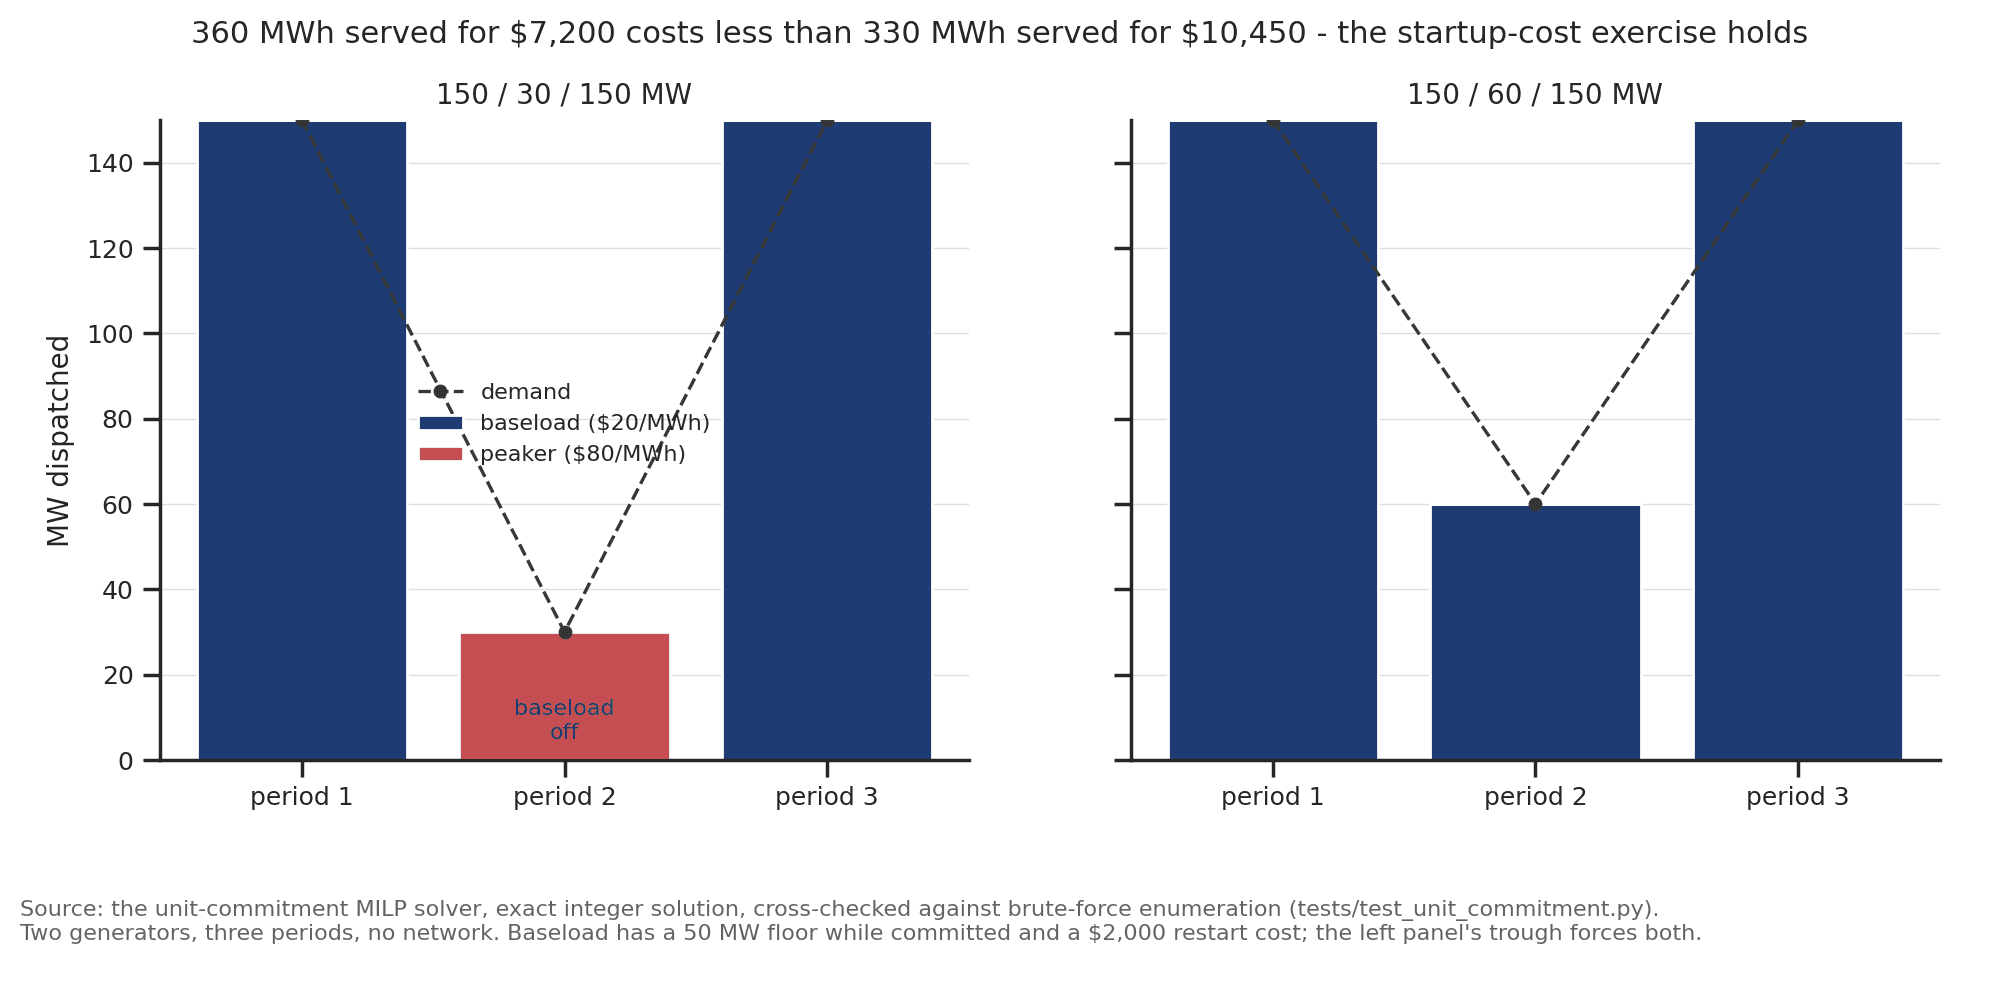
Higher total demand can produce lower total system cost when startup costs bind.
330 MWh at $10,450 vs. 360 MWh at $7,200 - the baseload unit's restart cost is the difference.
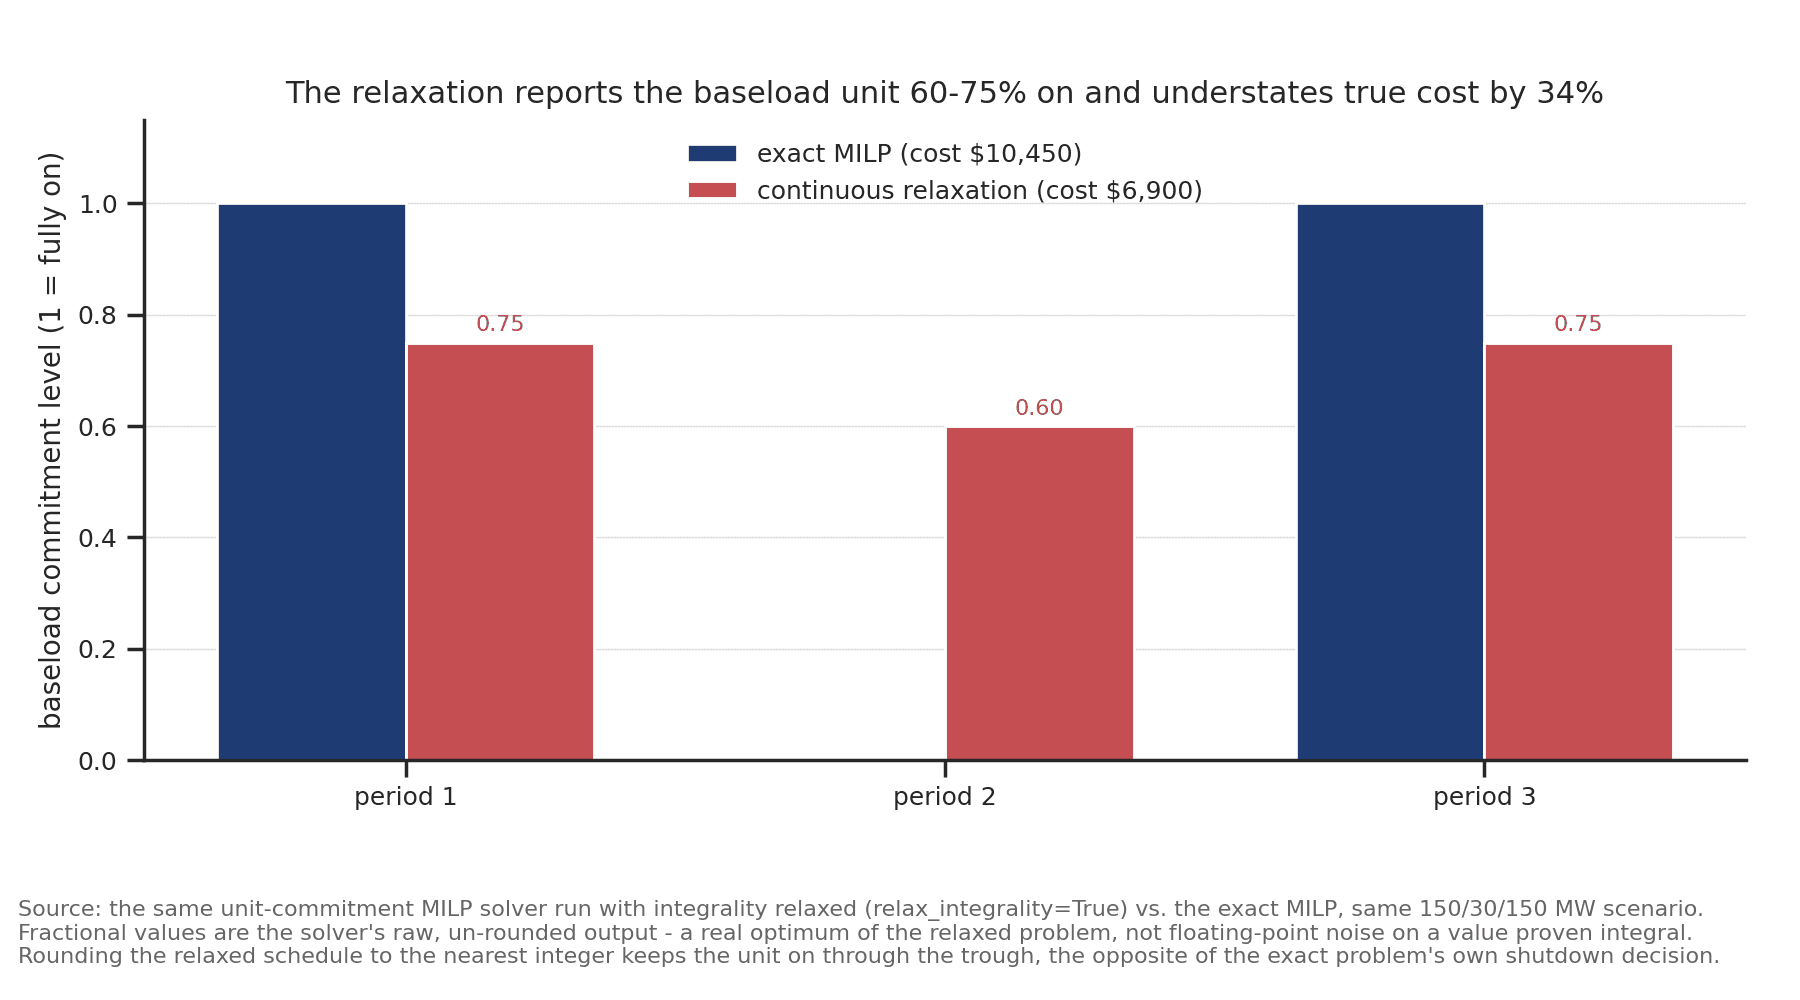
The relaxation reports the baseload unit 60-75% on and understates true cost by 34%.
Rounding the fractional result recovers the wrong schedule, not just an approximate cost.
10. Limitations
- One ISO, six months. January 2026 dominates the full-sample DART mean. OOS always-INC profitability on this window does not by itself establish a multi-year edge.
- Grid topology and generator fleet are not real. Section 9 uses an illustrative network. The GNN in Section 8 uses geographic distance as a graph proxy, not transmission topology.
- SCOPF is lossless DC without reliability-reserve requirements. Reserves exist in the unit-commitment module but are not wired into the SCOPF run shown here.
- Weather feeds the DART feature set only. It does not yet enter grid, risk, or storage modules.
- Deep sequence and graph models do not beat always-INC on this panel. That is a statement about this sample and feature set, not a general claim about those architectures.
- Weather is ERA5-family reanalysis, not airport METAR observations.
- Wholesale only. No retail pricing.
- Zone-hour pooling overstates independent sample size for t-statistics (cross-zone DART correlation ~0.95).
- 1 NYISO's published hourly real-time file is the duration-weighted integral over every five-minute dispatch execution, not the simple mean. Duration-weighted integration matches the published file to within half a publication tick over 2,160 zone-hours; a plain five-minute mean errs by up to $2.00/MWh.
- 2 A one-day-ahead forecast's issue hour is not exposed by the API and cannot be proven to precede the bid deadline for every model run. The two-day lead can.
- 3 Purged and embargoed walk-forward cross-validation (Lopez de Prado, Advances in Financial Machine Learning, 2018). Deflated Sharpe ratios applied to the resulting backtests.
- 4 Jha, A. & Wolak, F. (2019), "Testing for Market Efficiency with Transactions Costs: An Application to Convergence Bidding in Wholesale Electricity Markets" - CAISO convergence bids; measured profits largely vanish once realistic transaction costs are applied. Birge, Hortacsu, Mercadal & Pavlin (2020), "Limits to Arbitrage in Electricity Markets," Energy Economics 85. Hogan, W. (2016), "Virtual bidding and electricity market design," Electricity Journal 29(5).
Additional references: Kupiec, P., Journal of Derivatives 3(2), 1995 (VaR backtest). Stott, Alsac & Monticelli, Proceedings of the IEEE 75(12), 1987, and Capitanescu et al., Electric Power Systems Research 81(8), 2011 (SCOPF). Hersbach et al., QJRMS 146(730), 2020 (ERA5). Market structure framing also draws on Somani, Power 2026 (power2026.ai).
11. About
Independent research by Shubham Gaur. Questions and corrections welcome.